Publisher Dashboard
Overview
The Publisher Dashboard provides a centralized overview of the performance and activities across all journals managed within your publishing organization. It displays key publishing metrics, editorial workflow statistics, turnaround times, reviewer performance, and author insights, enabling administrators and publishers to monitor operations and make informed decisions.
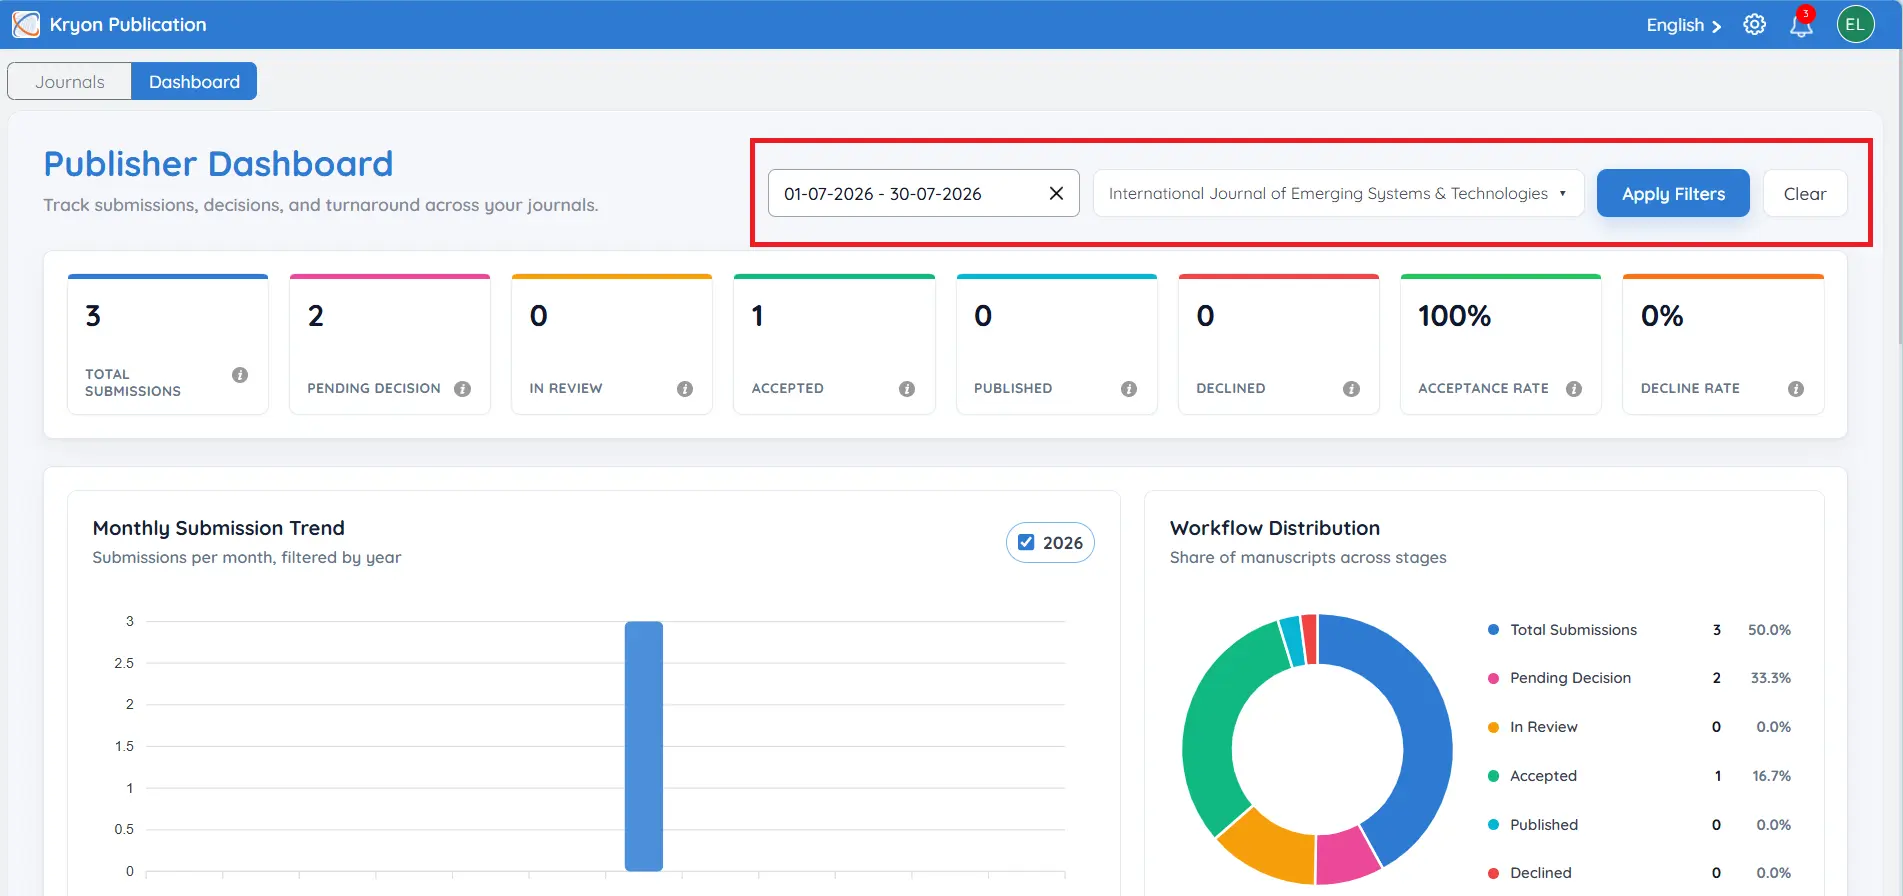
The dashboard data can be filtered by a specific date range and by individual journals or viewed across all journals.
Filtering Dashboard Data
Before viewing the dashboard metrics, you can filter the data to display the required information.
Date Range
Use the Date Range selector to view metrics for a specific period.
Journal Filter
By default, the dashboard displays data for All Journals.
To view metrics for a specific journal:
-
Click the All Journals drop-down.
-
Select the required journal.
-
Click Apply Filters.
To remove the applied filters, click Clear.
Key Performance Metrics
The top section of the dashboard displays high-level publishing statistics.
Total Submissions
Displays the total number of manuscripts submitted during the selected period.
Pending Decision
Shows the number of manuscripts awaiting an editorial decision.
In Review
Displays the number of manuscripts currently undergoing peer review.
Accepted
Shows the total number of accepted manuscripts.
Published
Displays the number of manuscripts that have been successfully published.
Declined
Shows the number of manuscripts rejected or declined.
Acceptance Rate
Displays the percentage of submitted manuscripts that have been accepted.
Decline Rate
Displays the percentage of submitted manuscripts that have been declined.
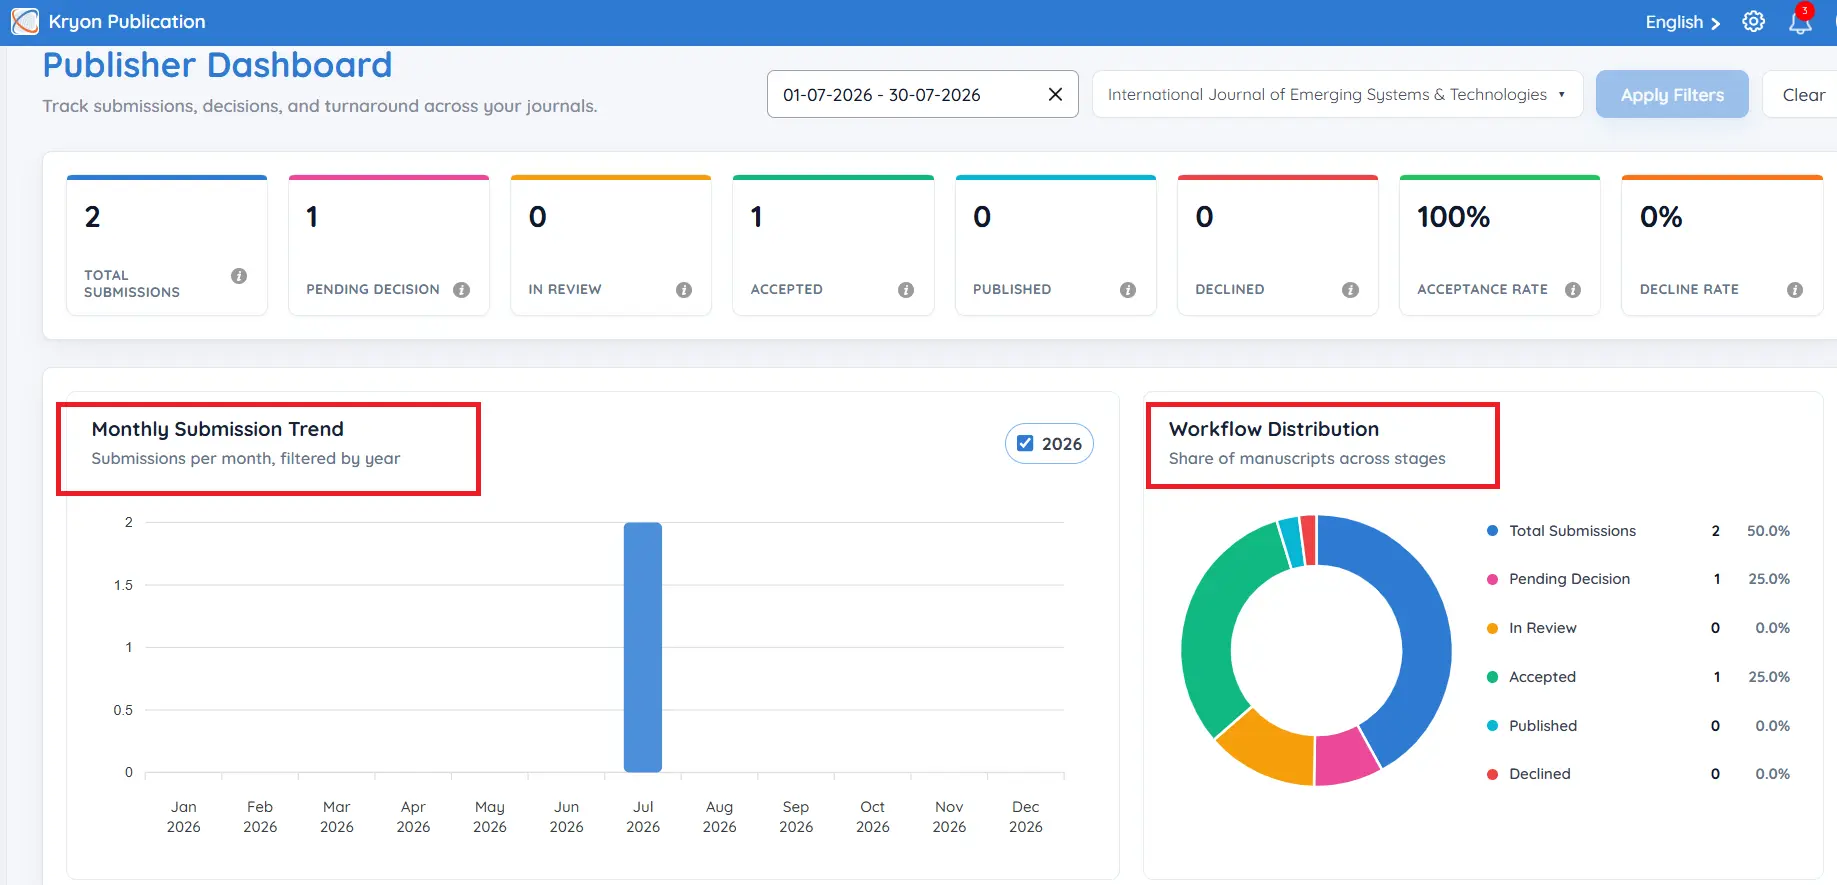
Monthly Submission Trend
The Monthly Submission Trend chart provides a graphical representation of manuscript submissions over time.
This helps publishers identify:
-
Submission growth
-
Seasonal trends
-
Peak submission periods
-
Publishing performance over time
Workflow Distribution
The Workflow Distribution section provides a breakdown of manuscripts at different stages of the editorial workflow.
It displays:
-
Total Submissions
-
Pending Decision
-
In Review
-
Accepted
-
Published
-
Declined
This helps administrators understand the current distribution of manuscripts across the publishing workflow.
Journal-wise Breakdown
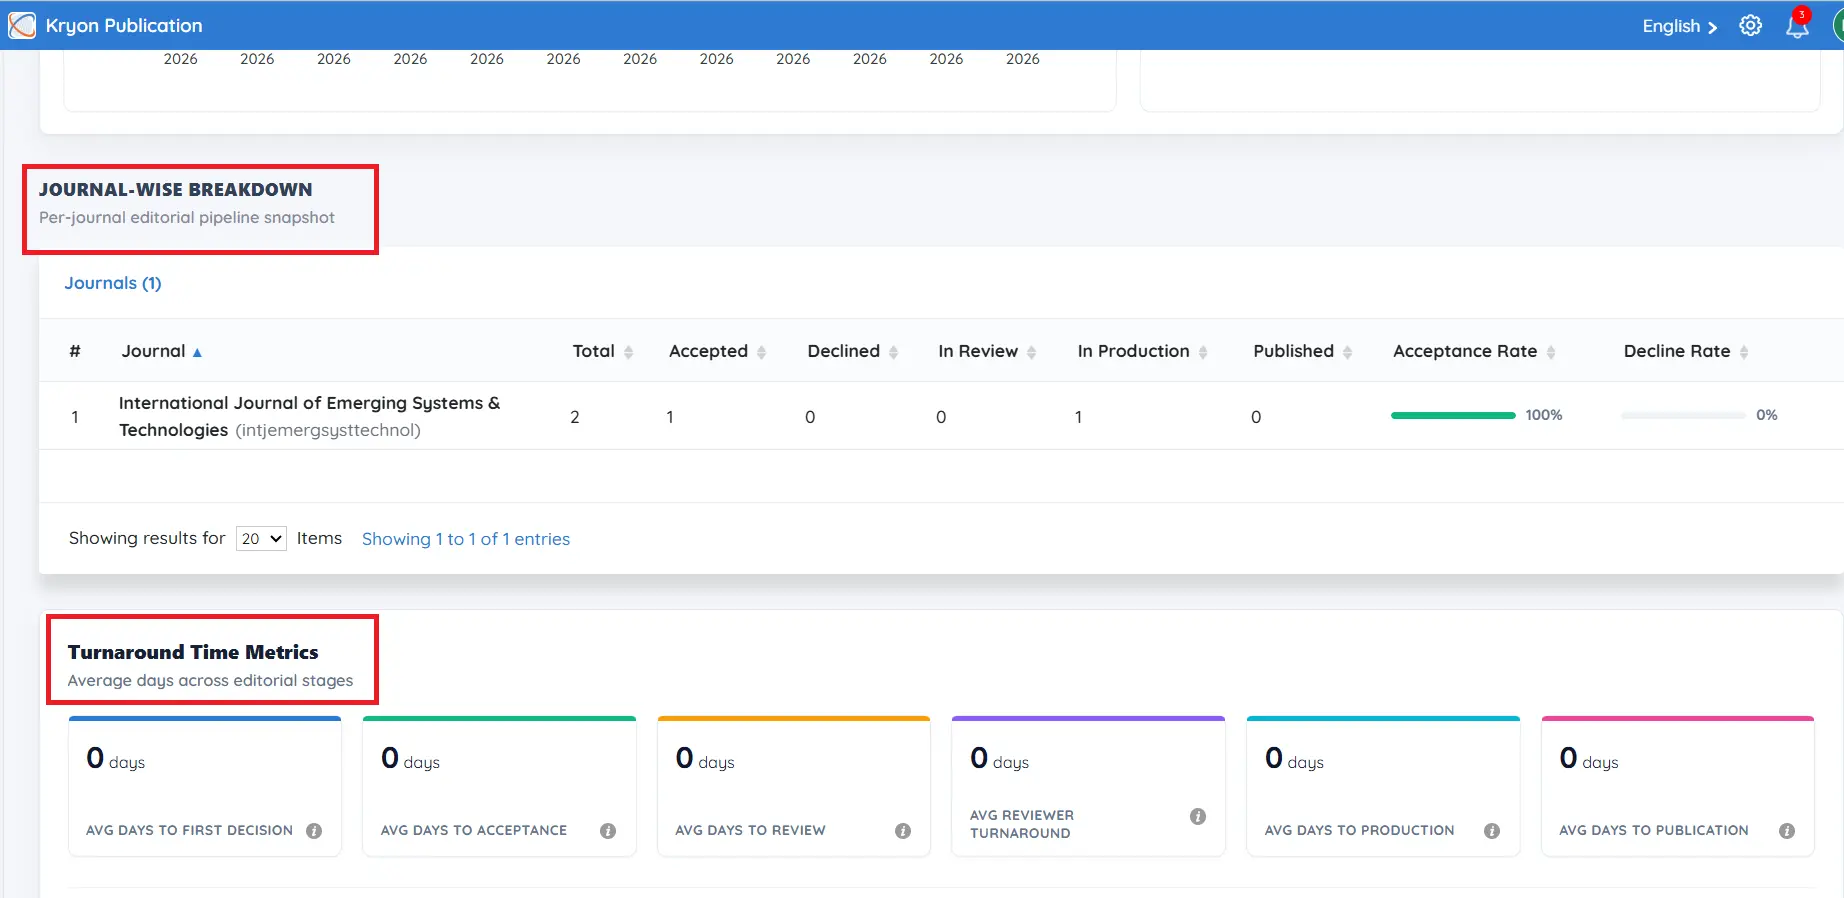
The Journal-wise Breakdown table provides performance statistics for each journal managed within the publishing organization.
For every journal, the dashboard displays:
-
Journal Name
-
Total Submissions
-
Pending Decision
-
In Review
-
Accepted
-
Published
-
Declined
-
Acceptance Rate
-
Decline Rate
This allows publishers to compare the performance of multiple journals from a single dashboard.
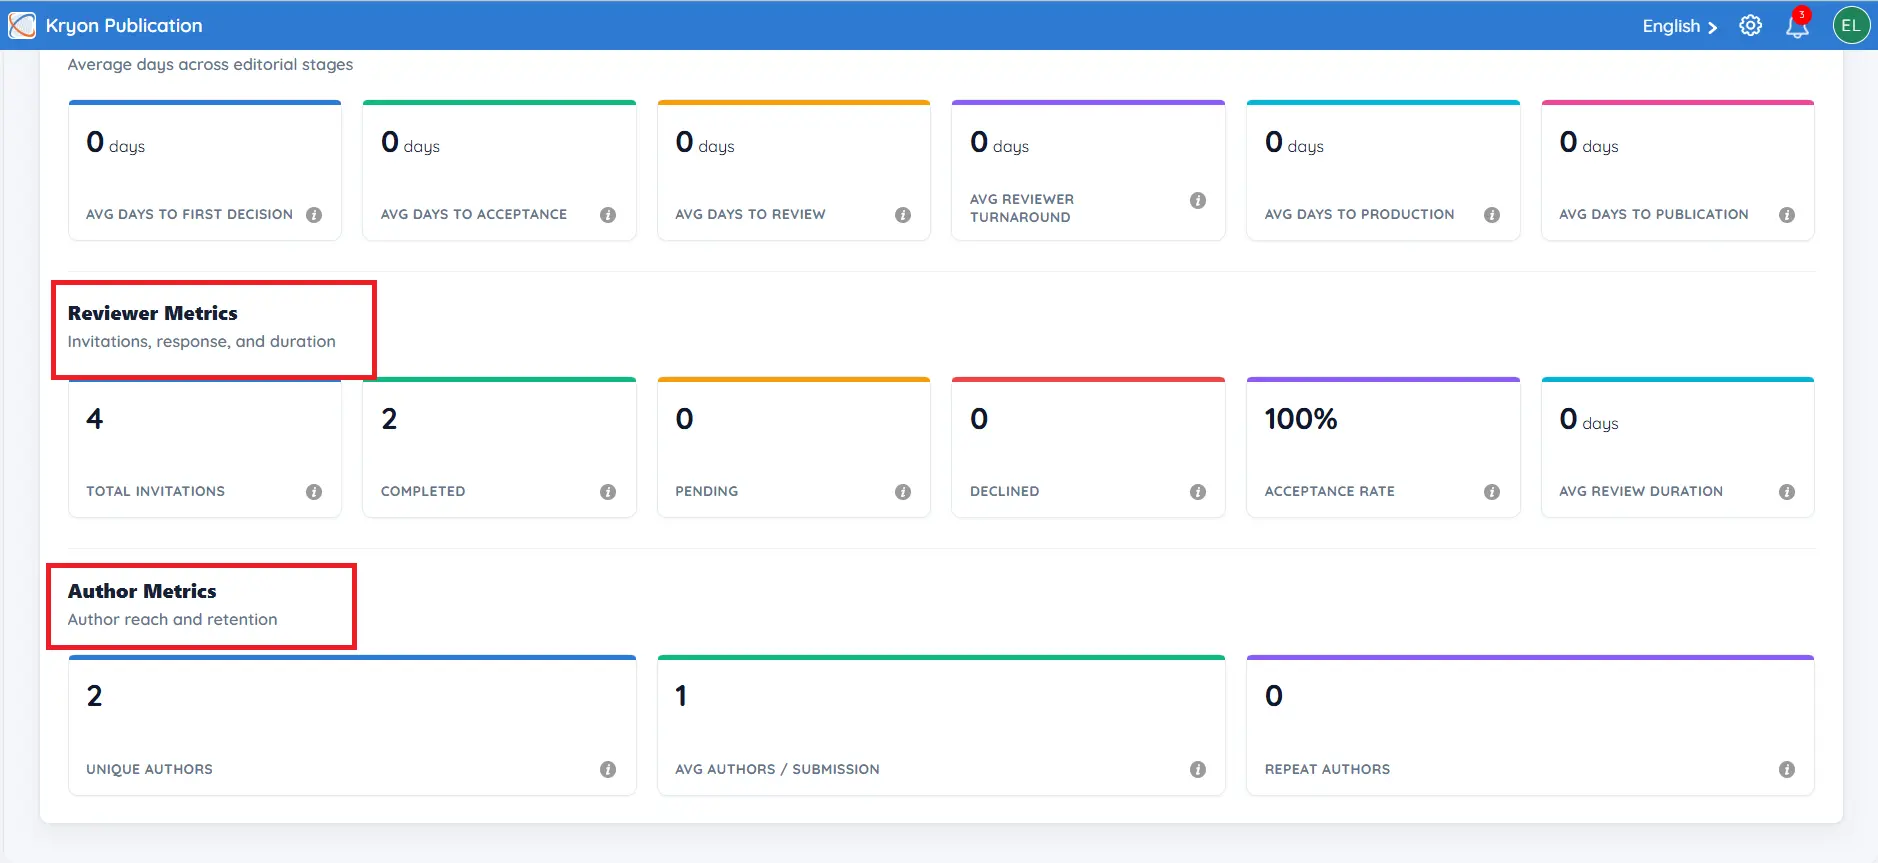
Turnaround Time Metrics
The Turnaround Time Metrics section measures the efficiency of the editorial and publishing process.
The dashboard displays:
Average Days to First Decision
The average time taken from manuscript submission to the first editorial decision.
Average Days to Acceptance
The average time taken for a manuscript to be accepted after submission.
Average Days to Review
The average duration of the peer review process.
Average Reviewer Turnaround
The average time reviewers take to complete and submit their reviews.
Average Days to Production
The average number of days taken to move a review accepted manuscript into the production stage.
Average Days to Publication
The average time taken from manuscript submission to final publication.
These metrics help identify workflow bottlenecks and improve editorial efficiency.
Reviewer Metrics
The Reviewer Metrics section provides insights into reviewer participation and performance.
The dashboard displays:
Total Invitations
The total number of review invitations sent to reviewers.
Completed Reviews
The number of reviews successfully completed.
Pending Reviews
The number of review invitations awaiting completion.
Declined Invitations
The number of review invitations declined by reviewers.
Reviewer Acceptance Rate
The percentage of review invitations accepted by reviewers.
Average Review Duration
The average time taken by reviewers to complete their evaluations.
These metrics help editors assess reviewer engagement and monitor the efficiency of the peer review process.
Author Metrics
The Author Metrics section provides statistics about author participation.
The dashboard includes:
Unique Authors
The total number of individual authors who submitted manuscripts during the selected period.
Average Authors per Submission
The average number of authors associated with each submitted manuscript.
Repeat Authors
The number of authors who have submitted more than one manuscript to the publishing organization.
These insights help publishers understand author engagement and submission patterns over time.