Reviewer Dashboard
Overview
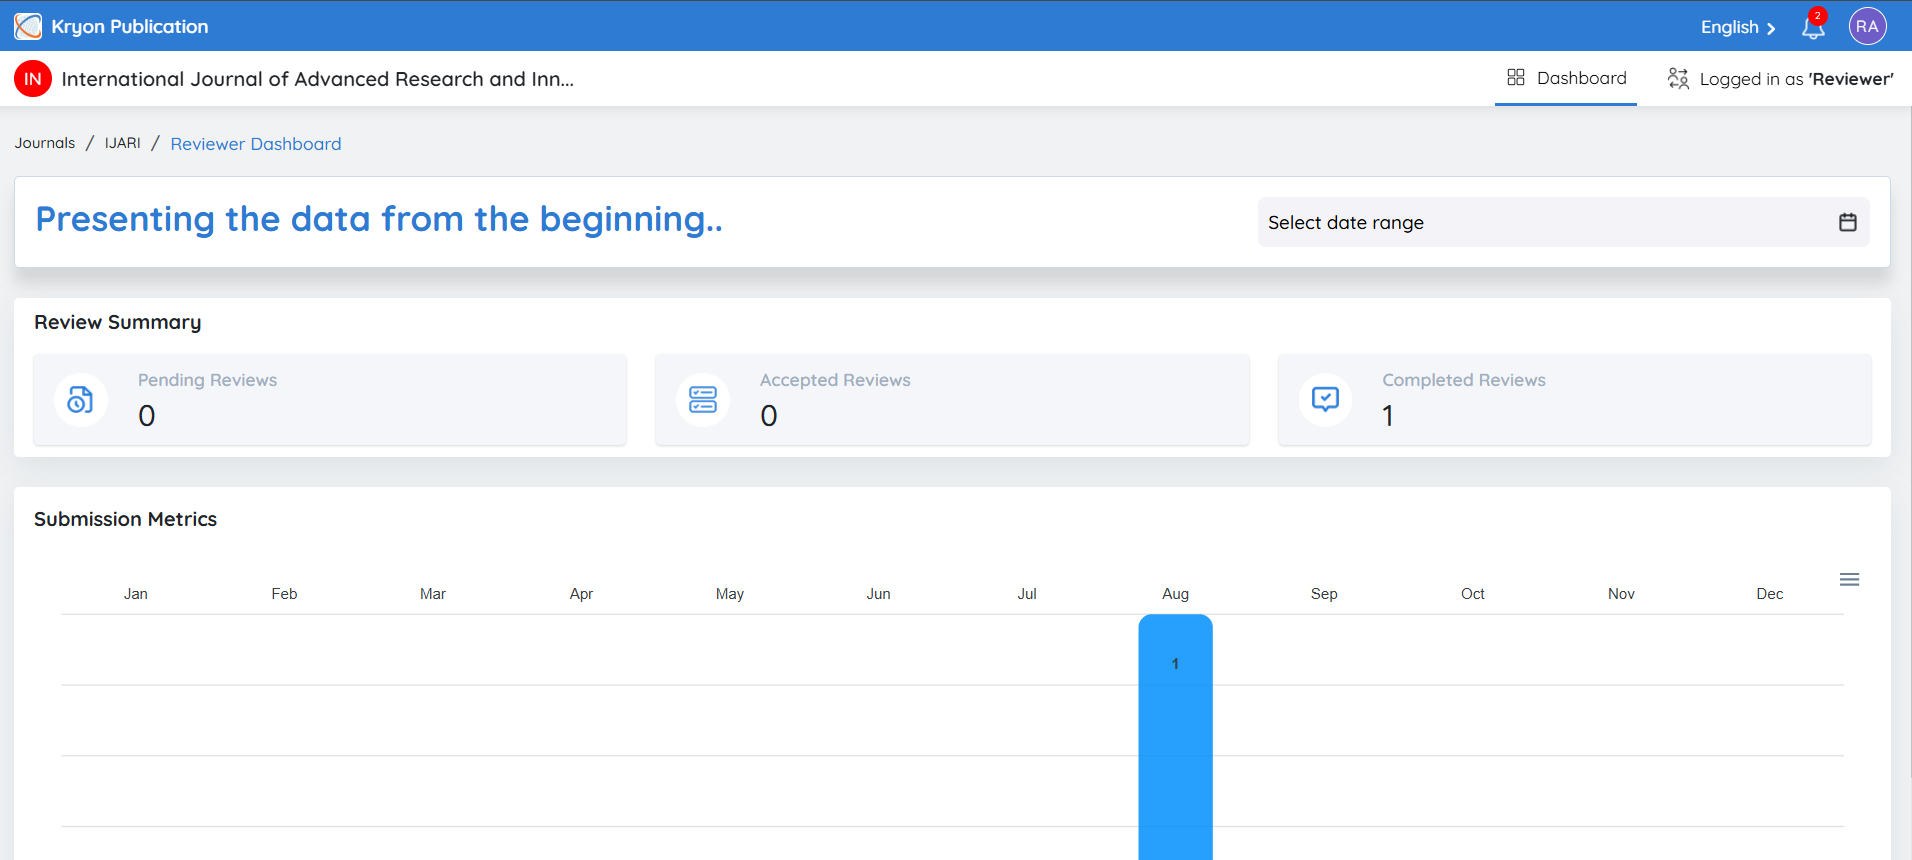
The Reviewer Dashboard provides reviewers with a centralized view of their review activities and performance within the journal. It displays key review statistics, submission trends, and review metrics, helping reviewers track their workload and contributions.
The dashboard is updated in real time and presents information through summary cards and graphical reports.
Date Range Filter
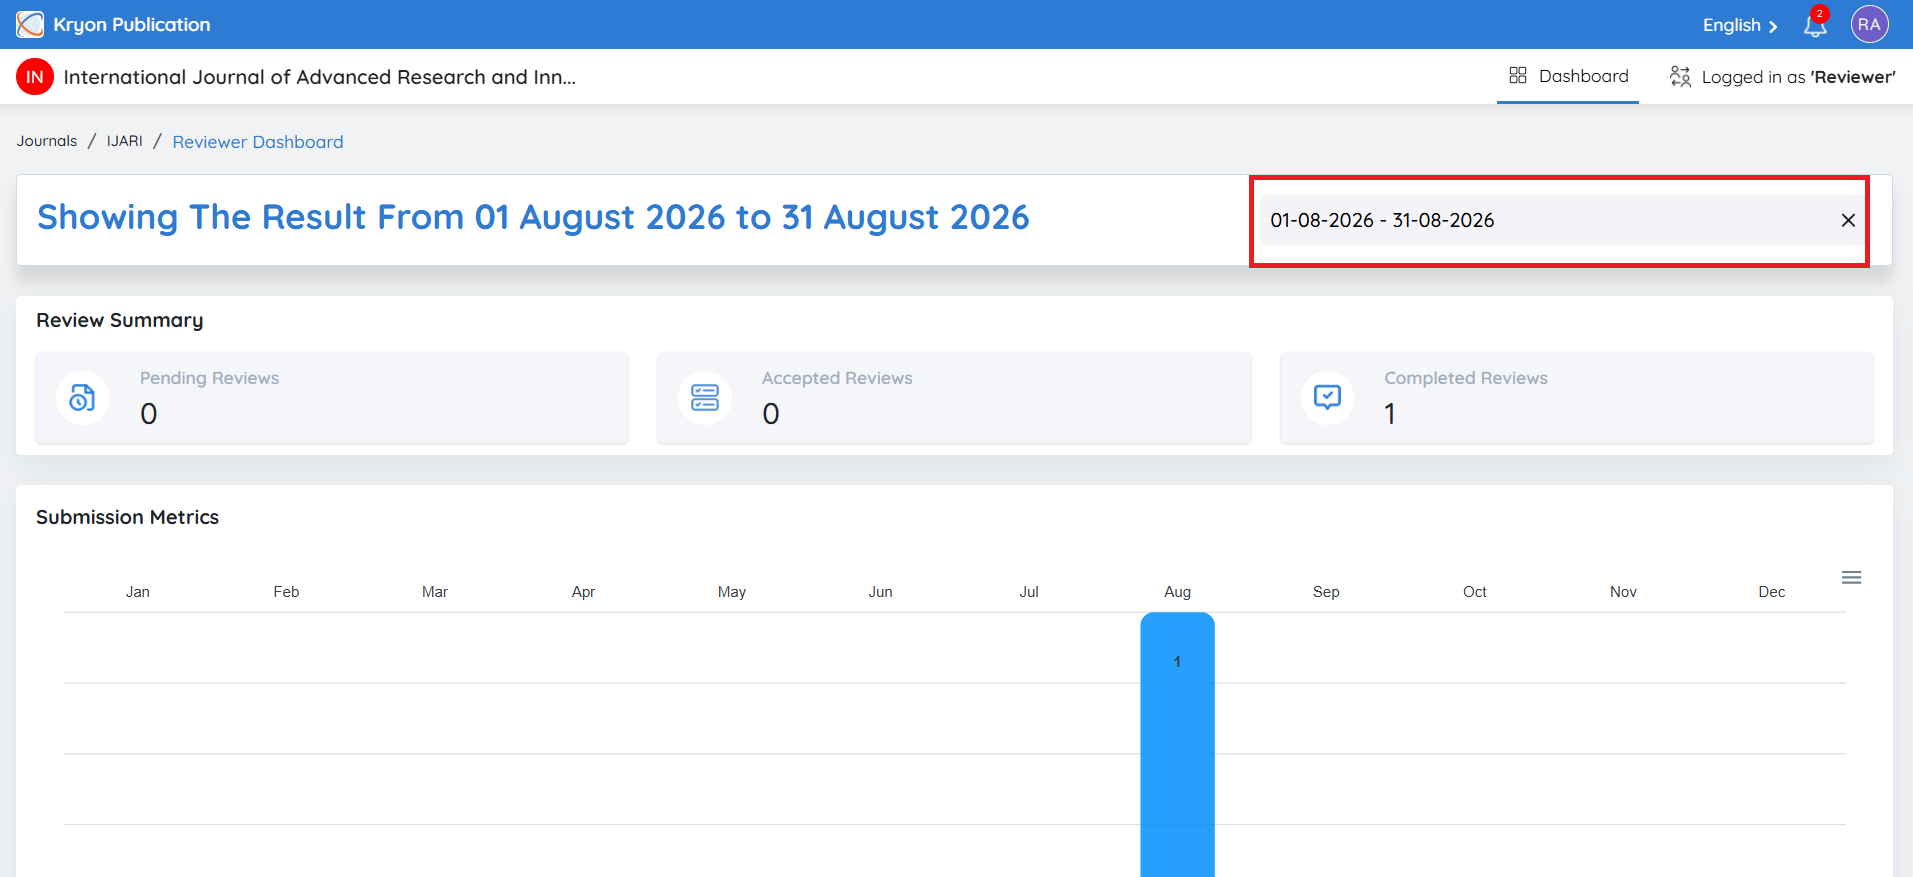
Use the Date Range selector at the top of the dashboard to filter the displayed statistics for a specific period.
After selecting the required date range, all dashboard metrics and charts are updated automatically to reflect the selected timeframe.
Review Summary
The Review Summary section provides an overview of your current review assignments.
Pending Reviews
Displays the number of review assignments that are awaiting your action.
Accepted Reviews
Displays the total number of review invitations you have accepted during the selected period.
This helps you monitor your active review commitments.
Completed Reviews
Displays the total number of reviews successfully submitted.
Completed reviews contribute to your reviewer activity and may also be considered for reviewer recognition or certificates, depending on the journal's configuration.
Submission Metrics
The Submission Metrics chart provides a month-wise visualization of your review activity.
The graph displays the number of review assignments completed each month, allowing you to:
• Track your reviewing activity over time.
• Identify periods of higher review workload.
• Monitor your overall contribution to the journal.
The chart updates automatically based on the selected date range.
Dashboard Benefits
The Reviewer Dashboard helps reviewers to:
• Monitor pending and completed review assignments.
• Track accepted review invitations.
• Visualize monthly review activity through interactive charts.
• Measure their overall reviewing contribution.
• Quickly access key review statistics from a single location.